Third Quarter Results: Biotage, Bio-Techne, HORIBA and Shimadzu
Chapter Outline Minimize

Biotage Reports Strong Sales in China and the Europe & EMEA Region

Biotage by Product Line Q3 FY20
 

Rev. (M)

Chg.

Total Company

SEK 262.6

-7.1%

Systems

SEK 237.3

-7.7%

Service Contracts and Other Services

SEK 23.6

0.1%

Other Sales Revenue

SEK 1.7

-18.1%

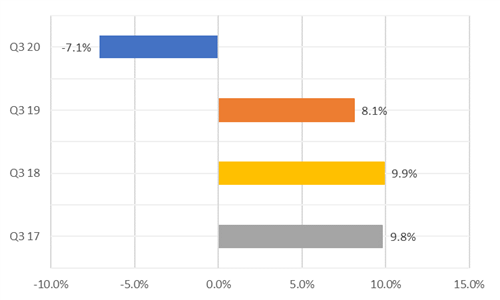
Biotage concluded the third quarter with revenues declining in the high single digits. Organic sales fell 7.1% to SEK 262.6 million ($29.6 million at SEK 8.87 = $1) (see IBO 9/1/20). On a reported basis, systems and aftermarket product sales accounted for 51% and 49% of revenues, respectively.

Biotage Operating Profit Q3 FY20

Op. Profit (M)

Chg.

Op. Margin

Chg. (bps)

SEK 60.7

-5.6%

23.1%

37

Despite reported and organic sales declines for the third quarter, Biotage experienced a 3.3% rise in sales sequentially. The company attributed its third quarter financial performance to cost control and its products meeting demand in COVID-19 vaccine and therapeutic development. However, Biotage still weathered COVID-19-related headwinds, such as business disruptions stemming from global lockdown measures. Additionally, Biotage saw stable demand in the precision medicine market and for non-COVID-19-related product lines.

Biotage by Region Q3 FY20
 

Rev. (M)

Chg.

% of Rev.

Americas

SEK 111.8

-12.9%

43%

Europe & EMEA

SEK 69.6

5.9%

26%

Asia

SEK 81.2

-8.3%

31%

On a geographical basis, Biotage reported significant sales growth in Europe & EMEA and specific regions within Asia, especially China. Indeed, the greatest revenue growth for the company came from China. However, China's strong performance could not offset tepid sales in India and Japan due to both regions experiencing business disruptions because of COVID-19.

Europe & EMEA was the only region besides China to report sales growth for Biotage thanks to end-users resuming activities in the area. However, the company noted that sales recovery in Europe & EMEA was proceeding at a slow pace.

Biotage by Division Q3 FY20
 

Rev. (M)

Chg.

Organic Chemistry

SEK 141.8

7.1%

Analytical Chemistry

SEK 86.2

-8.4%

Scale-Up (formerly Industrial Products)

SEK 25.5

-46.3%

Biomolecules

SEK 9.1

4.5%

By division, the Organic Chemistry business performed the best due to robust sales for its instrument portfolio in China. In contrast, Biotage's Scale-Up division was the worst performer due to tepid demand from the cannabis market, especially in the Americas.

Biotage by Sales Q3 FY20
 

Rev. (M)

Chg.

% of Rev.

Direct Sales

SEK 245.3

-8.9%

93.4%

Distributors

SEK 17.2

28.5%

6.6%

Biotage did not provide revenue guidance for the fourth quarter or full year. However, the company provided commentary for the remainder of 2020, stating it was in good financial standings to weather any external challenges yet still considered pandemic-related challenges. For example, the company anticipates a longer wait in receiving payment from customers whose own financial position could be impacted by the pandemic. Lastly, Biotage reaffirmed its forecast of an average annual organic sales growth goal of 8% over three years (see IBO 9/11/20).

Biotage Q3 FY20 Sales Change. Comparison

Bio-Techne Starts Fiscal 2021 with Strong Sales Growth

Bio-Techne by Division Q1 FY21
 

Rev. (M)

Chg.

Acq./Div.

Currency

Organic Chg.

% of Rev.

Total

$204.2

11.4%

0%

1%

10%


Protein Sciences

$154.4

9.5%

0%

2%

8%

76%

Diagnostics and Genomics

$50.1

17.8%

0%

1%

17%

25%

Intersegment

-$0.4

22.4%

ā€”

ā€”

ā€”

ā€”

Bio-Teche's fiscal first quarter revenue performance (see IBO 8/17/20) reached pre-pandemic levels, posting double-digit growth on both a reported and organic basis. The company's organic sales performance exceeded expectations, which was initially a flat organic sales rate forecast. Bio-Techne attributed its financial performance to laboratory customers reopening worksites and resuming paused projects due to COVID-19 lockdown measures. The company's revenue was driven by an increase in demand from both the biopharmaceutical and academic end-markets after a tepid response in the fiscal fourth quarter. Lastly, Bio-Techne's COVID-19-related research product sales contributed three-percentage points to total revenues.

Bio-Techne Operating Margin by Division Q1 FY21
 

Adj. Op. Margin

Chg. (bps)

Total

38.7%

576

Protein Sciences

45.6%

332

Diagnostics and Genomics

17.5%

1537

Protein Sciences business revenues were driven by strong sales of its Simple Western and Simple Plex products, posting about 35% and 75% growth, respectively. Additionally, Protein Sciences' reagents portfolio sales improved sequentially but posted a flat sales rate on a year-over-year basis. End-market wise, reagents portfolio sales were robust in the biopharmaceutical end-market yet were moderate in the academic laboratory sector due to the slow reopening of laboratories.

The Diagnostics and Genomics division was also a strong performer, posting double-digit organic and reported sales growth. Genomics segment revenue grew approximately 30% thanks to robust sales in the RNA Scope product line and 60% revenue growth in the pharmaceutical assays service business. Within the Diagnostics division, the Exosome Diagnostics portfolio experienced a 125% sales uptick thanks in part to a surge in volume of ExoDx testing, which was close to pre-COVID-19 pandemic levels.

Bio-Techne by Region Q1 FY21
 

Rev.

Chg.

% of Rev.

US

$113.6

11.0%

56%

EMEA, excl. UK

$43.1

11.2%

21%

UK

$8.5

12.5%

4%

APAC, excl. Greater China

$15.7

12.3%

8%

Greater China

$18.1

12.3%

9%

Rest of World

$5.2

17.5%

3%

On a geographical basis, the US and Europe posted approximately 10% organic revenue growth because of stable demand from both the biopharmaceutical and academic end-markets. Specifically, both regions grew revenues in the high-teens in the biopharmaceutical end-market while also seeing a sales recovery in the academic sector resulting in mid-single-digit revenue growth.

Sales in China grew in the high teens despite an uptick in coronavirus infection rates at the beginning of the quarter. Specifically, early in the quarter, Chinese sales suffered from laboratories closing due to social distancing restrictions.

Lastly, Asia's revenues increased in the high single digits, with most countries posting significant sales growth. However, pandemic-related shutdowns in India and Australia partially impacted sales for the region.

Bio-Techne did not provide a forecast for the fiscal second quarter but did for fiscal 2021. The company predicted that annual sales would experience a double-digit revenue increase and expect this sales rate to continue in subsequent years.

Bio-Techne Q1 FY21 Sales Comparison by Divisions

HORIBA Posts Sequential Sales Growth

In the first nine months of 2020, the COVID-19 pandemic continued to disrupt HORIBA's business operations for its Scientific Instruments & Systems (SI) and Process & Environmental Instruments and Systems (P&E) divisions. Despite these challenges, the company's combined sales for SI and P&E rose 2.3% in the third quarter to ¥11,090 million ($104.5 million at ¥106.16 = $1) and made up 24% of the total company sales (see IBO 10/15/20). Please note the charts' financial information is on a quarterly basis sourced from both HORIBA and IBO's calculations. Additionally, the information below stems from both HORIBA's third quarter and nine-month financial data.

HORIBA by Division Q3 FY20
 

Rev. (M)

Chg.

% of Rev.

Process & Environmental Instruments & Systems

¥4,125

-12.4%

9%

Scientific Instruments & Systems

¥6,965

13.6%

15%

P&E's nine-month sales benefitted from public utility end-users' continuing projects, yet the business saw a slow investment rate from these customers in that same period. As a result, P&E's nine-month revenues fell 7.7% to ¥12,799 million ($120.6 million). P&E quarterly operating income decreased 21.8% to ¥323 million ($3.0 million), while its nine-month operating income fell 21.8% to ¥763 million ($7.2 million).

Thanks to a sequential increase in quarterly revenue, P&E raised its fourth quarter and annual revenue forecasts. For the fourth quarter, the business anticipates sales of ¥5,200 million ($49.0 million), which would result in a 7.6% decline. For its annual guidance, P&E expects revenues to increase from ¥17,500 million ($164.8 million) to ¥18,000 million ($169.6 million), leading to a 7.7% decrease (see IBO 10/15/20). Additionally, the division reaffirmed the continuation of low oil industry demand due to customers' poor capital investment in equipment and falling global oil prices (see IBO 10/15/20).

HORIBA by Region Q3 FY20
 

SI

PE


Rev. (M)

Chg.

Rev. (M)

Chg.

Japan

¥1,202

-22.3%

¥2,143

-13.1%

Asia

¥2,124

29.0%

¥921

-1.2%

Americas

¥2,132

18.1%

¥548

-17.5%

Europe

¥1,507

32.9%

¥514

-20.7%

SI's quarterly revenue experienced a double-digit increase and posted an operating gain of ¥688 million ($6.5 million), which was an improvement from the operating loss of ¥167 million ($1.6 million). In contrast, SI's first nine-month revenue performance decreased by 2.6% to ¥18,332 ($172.7 million). The business attributed its sales performance to slow R&D activity in various industries, offsetting strong sales of its semiconductor-related measurement products, and high market demand from the pharmaceutical and life science sectors. Additionally, SI posted a nine-month operating income increase of ¥852 million ($8.0 million), which was an improvement from the operating loss of ¥257 million ($2.4 million). SI credited this operating income performance to a reduction in selling expenses.

Like P&E, SI's third quarter sales improved sequentially, yet the business reaffirmed its full-year 2020 revenue forecast of ¥26,500 million ($249.6 million), which would be a 2.5% decrease (see IBO 10/15/20). Additionally, SI predicts fourth quarter sales to be ¥8,167 million ($76.9 million), which would result in a 2.1% decline.

HORIBA Q3 FY20 Operating Profit Comparison of Process & Environmental and Scientific Instruments (SI)

Shimadzu Sees Slow Recovery in Academic and Government Markets

Shimadzu Analytical & Measuring Instrument's (AMI) fiscal second quarter revenues declined 2.6% to ¥62.1 billion ($585 million at ¥106.16 = $1), with local currency growth of 4.0%. Sales accounted for 63% of total company revenues (see IBO 11/16/20). Please note that the charts' financial information is on a quarterly basis sourced from both Shimadzu and IBO's calculations. In contrast, the information in the articles stems from Shimadzu AMI's fiscal first-half 2021 financial data.

Shimadzu AMI by Product Line Q2 FY21
 

Rev. (B)

% Chg.

Local Currency Chg.

Total

¥62.1

-2.6%

-4.0%

Key Models

¥34.8

5.2%

2.0%

Other

¥27.3

-11.0%

-

For the fiscal second quarter and the first half of 2021, Shimadzu AMI reported a low single-digit revenue decrease. Sales of COVID-19-related PCR diagnostic kits totaled ¥1.1 billion ($10.4 million) in the fiscal first-half of 2021. But Shimadzu AMI sales suffered from closures of automotive and academic worksites due to the COVID-19 pandemic.

Shimadzu AMI Operating Margin Q2 FY21

Op. Profit

Chg.

Local Currency Chg.

Op. Margin

Chg. (bps)

¥11.8

10.0%

7.0%

19.0%

218

By end-market, fiscal first-half 2021 sales to the three main sectors were mixed. The pharmaceutical/contract analysis/healthcare/food market was the only one that was positive thanks to strong global demand from pharmaceutical and healthcare end-users. Within the pharmaceutical, public health and healthcare sectors, Shimadzu AMI saw significant sales growth for its Key Model and Other Models' portfolios. Regarding the Key Model line, sales of its LC, MS and GC products in the pharmaceutical, healthcare and public health fields were strong, respectively. Other Models sales benefitted from demand from the COVID-19-related marketplace, especially Shimadzu AMI's COVID-19-related PCR diagnostic kits. However, overall Other Models revenue declined for both the fiscal second quarter and first-half 2021 because of a slow recovery of transport equipment and other industrial fields customers resuming capital equipment investment.

On a geographical basis, chemicals/materials/electrical/automotive sales continued to recover in China yet decreased in other regions. Additionally, demand was low from the automotive industry.

The closing of academic institutions and governments suspended bidding for projects, negatively impacting AMI sales to this sector. Though government-related sales performed poorly overall, Shimadzu AMI observed pockets of growth resulting from some government-users resuming funding and bidding.

Shimadzu AMI H1 FY21 End-Market Sales Breakdown

In Japan, sales finished down due to waning demand for Shimadzu AMI's testing machines, nondestructive inspection machines, and other products in the country's transport equipment, chemical and electrical industries. Additionally, fiscal first-half 2021 revenues faced a tough comparison due to a sales uptick from last year, which occurred because end-users wanted to buy equipment before Japan increased its consumption tax.

Shimadzu AMI sales in China saw strength due to demand for LC and MS systems from the pharmaceutical and food safety industries. LC and MS system sales were also robust due to the country's investment in fighting the pandemic and preparing to release the 2020 Chinese Pharmacopoeia.

In Other Asian Countries, overall sales tumbled yet improved on a sequential basis. Sales began to recover after facing challenges stemming from pandemic-related lockdown measures. In India, sales for Shimadzu AMI's LC and MS products improved as the country's pharmaceutical industry resumed domestic drug manufacturing after a slowdown of China imports.

North American sales improved sequentially after a high single-digit decline in the fiscal first quarter, resulting from social distancing restrictions (see IBO 9/15/20). For the fiscal first-half of 2021, regional sales grew thanks to healthcare institutions purchasing MALDI-MS systems to detect and identify microorganisms inside hospitals.

Within Europe, LC and MS systems' demand rose as Russia's food safety market began to export agricultural and food products to other European countries. In contrast, academic market sales in Europe tumbled because of the temporary closures of universities.

Shimadzu AMI by Region Q2 FY21
 

Chg.

Local Currency Chg.

% of Rev.

Japan

-13.1%

-15.0%

40%

Americas

6.8%

-

12%

North America

10.8%

13.0%

-

South America

-22.4%

-

-

Europe

-3.4%

-5.0%

10%

China

15.3%

14.0%

23%

Other Asia

-1.2%

-9.0%

11%

India

15.9%

-4.0%

-

Other

0.4%

-

2%

Shimadzu AMI forecasts the fiscal year 2021 sales decline 8.2% to ¥228.0 billion ($2.1 billion), with local currency growth falling about 3%. On a geographical basis, throughout the year, revenues are predicted to recover in China, while other regions may face pandemic-related challenges.

For the latter half of fiscal 2021, Shimadzu AMI forecasts the pandemic will continue to impact its overall business on both a geographical and end-market basis yet expects pockets of sales growth in specific sectors. For example, the company believes the chemicals/materials/electrical/automotive market will face the most challenges due to decreased capital investments and other factors affecting the automotive, steel and chemical materials and machinery industries.

Thanks to the reopening of academic worksites and governments resuming bidding for projects, the academia/government end-market is expected to fare better. Additionally, because of the pandemic, the company anticipates demand in the government market to increase as countries initiate R&D projects to counter future pandemics.

Lastly, Shimadzu AMI expects pharmaceuticals/contract analysis/healthcare/food sector sales to grow in the latter half of fiscal 2021. For instance, the company sees high demand for its COVID-19-related PCR detection kits outside of Japan. Additionally, in China, the company forecasts sales will increase due to the 2020 Chinese Pharmacopoeia release. Lastly, Shimadzu AMI predicts robust demand in the overall pharmaceutical and virus research markets.

Shimadzu AMI Q2 FY21 Sales Comparison of Key Models and Other Models

*Correction: IBO miscalculated Shimadzu AMI's South American Q1 FY21 revenue in the quarterly write-up (see IBO 9/15/20). The country's quarterly sales tumbled 55.6%, not 95.6%, as previously reported. Please refer to the table below, showing the correction.

Shimadzu AMI by Region Q1 FY21
 

Chg.

Local Currency Chg.

% of Rev.

Japan

1.0%

-11.0%

36%

Americas

-14.2%

-

12%

North America

-6.8%

-4.0%

-

South America

-55.6%

-

-

Europe

-9.1%

-5.0%

10%

China

9.8%

12.0%

29%

Other Asia

-23.6%

-25.0%

11%

India

-29.9%

-35.0%

-

Other

-26.2%

-

2%